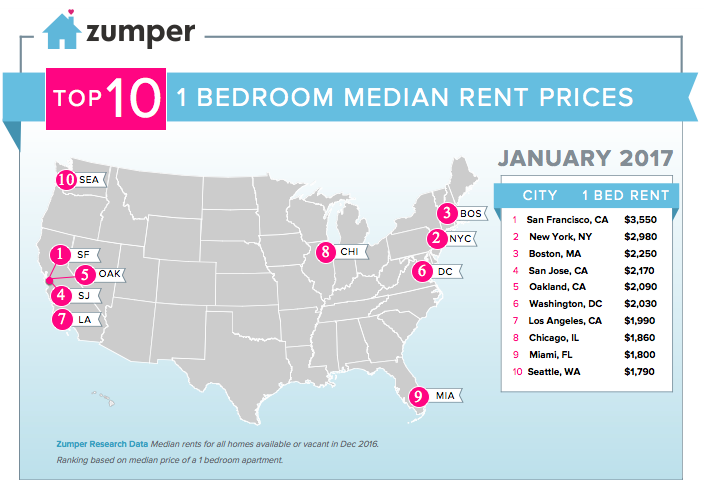
Topping the rent charts nationwide, $3500/month for 1-bedroom unit is as real as is obscene. But where did it go wrong for San Francisco and is it really so bad as it looks?
The supply side is pretty straightforward: available housing in San Francisco is scarce. Here’s why:
Geographic constraints.
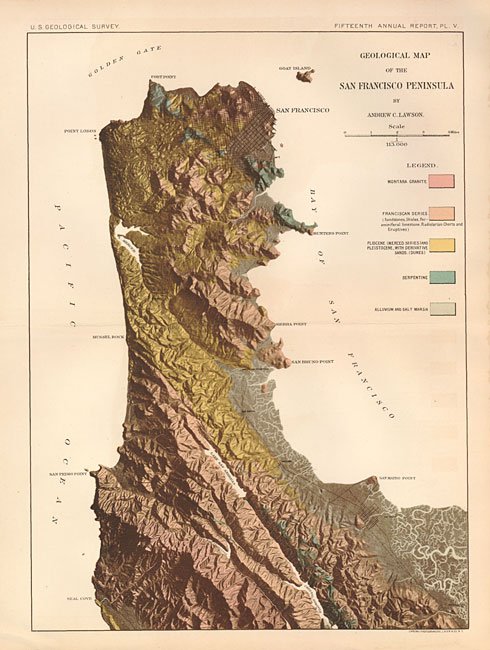
Bay Area doesn’t have much land available to build out. San Francisco is a 7-by-7 mile city with sprawling problematic, to say the least, Bay Area included, with large swathes of surrounding territories classified as preserves forbidden for development. Mountains, steep ridges further limit the space for housing construction. Not only coastal cities are naturally limited by water, but San Francisco city occupies a peninsula. Well, Manhattan is an island, you might say. Yes, and Manhattan’s famous skyline played a part in why San Francisco simply doesn’t do density.
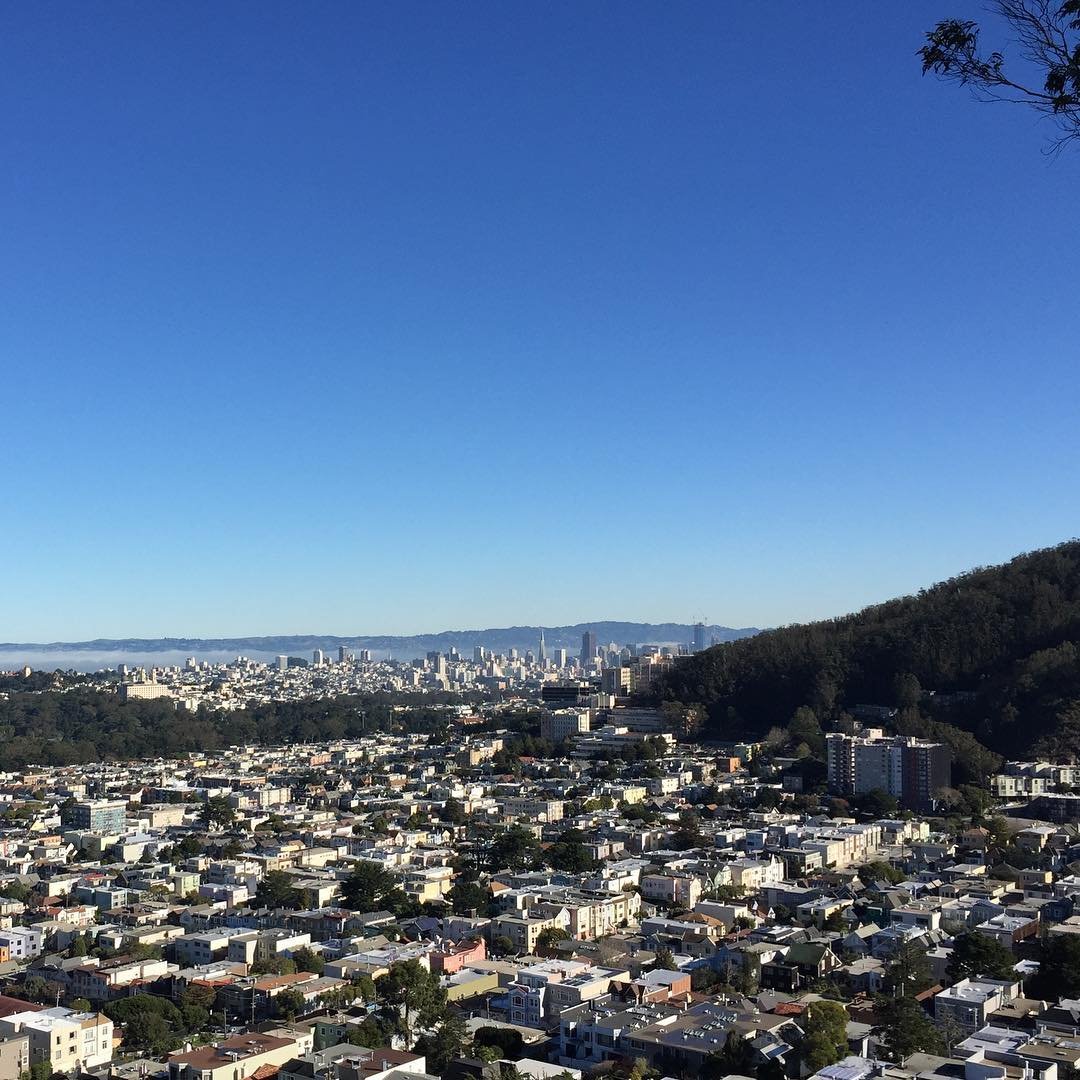
Vertical expansion was always regulated but is a no-go since the 1970s when residents, concerned with ‘Manhattanisation’ of the city, pushed for protective legislation.San Francisco has strict height-zoning and sunlight-reserving regulations, limiting construction of buildings that shade certain public spaces. Frequent earthquakes also do not help the cause of building up. Throw in untouchable historical buildings and Not-In-My-Backyard attitude championed by the locals to get the picture why San Francisco is slow on expanding housing.
Tech is booming
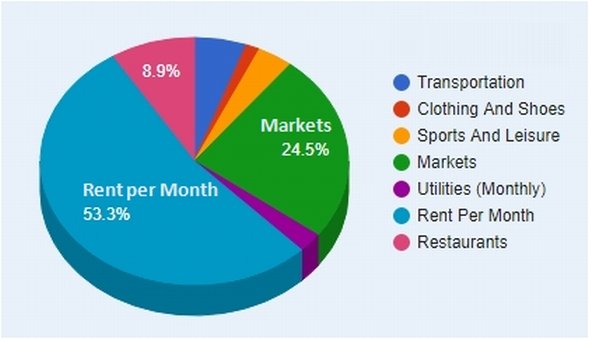
and here the demand side of the equation comes into play. High-paying tech industry fuels the prices on the housing market and most employees plough almost half of their earnings into the landlords’ pockets. But one outraging truth is that rent in San Francisco even lags behind the increasing income, according to SmartAsset calculations. No wonder homeowners are cashing in on recent windfall in the IT sector continuously pushing out those who cannot afford the rent. 80 000 moved out of the city in 2015 alone with well-to-do engineers and other white-collar workers taking their place.
Where do the ridiculous rent figures come from?
Depending on who you ask median rent prices vary quite elastically. Based on ‘price asked’ they’re well above $3000 per month. The US Census Bureau though recently reported that San Franciscans are spending just 26% of their income on housing (averaging on much more reasonable $1700 per month) and this may be correct as the USCB takes into account the controlled-rent units which don’t go on offer. The latter doesn’t mean you’ll get a coveted rent-controlled apartment should you move to SF right now – those change hands without making it to the Craigslist.
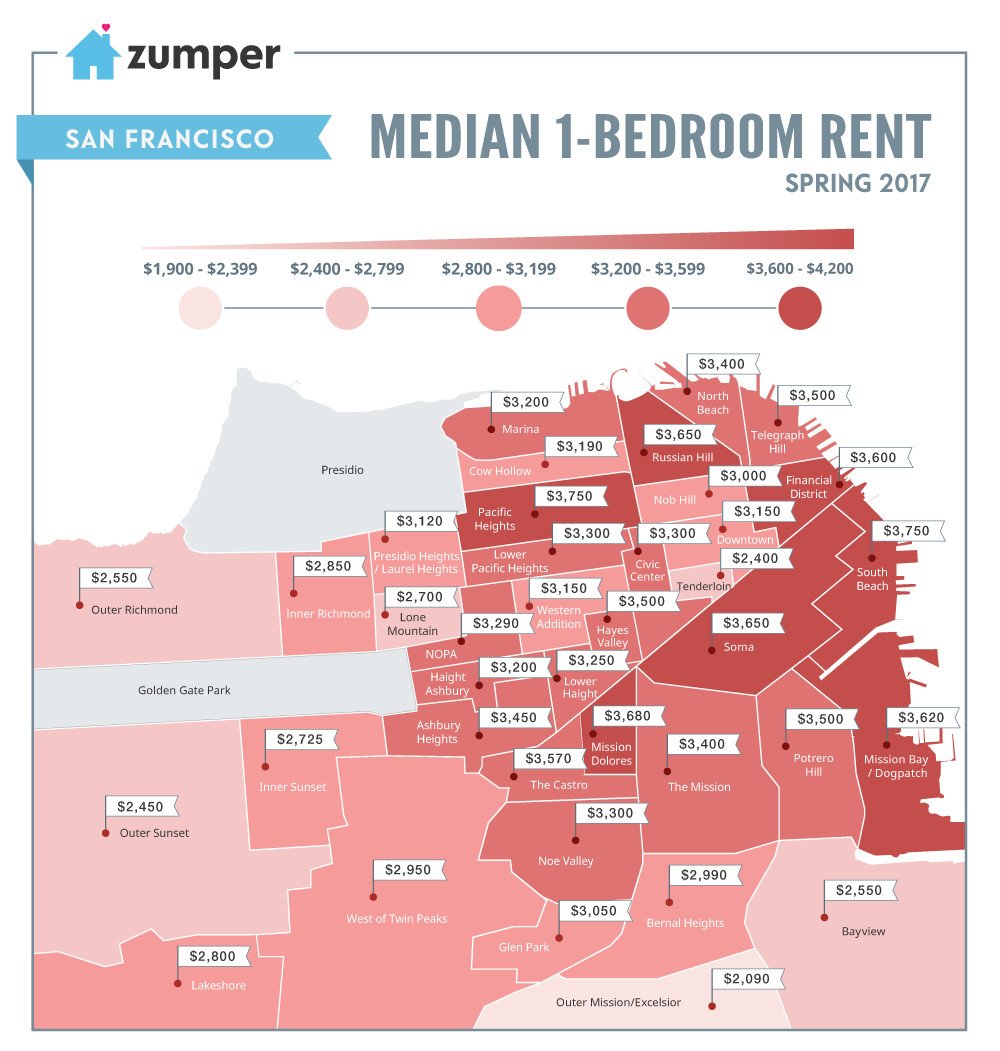
Realtors are saying that the market is cooling now with a drop in rates between 0.4% and 4% compared to 2016. What a relief.
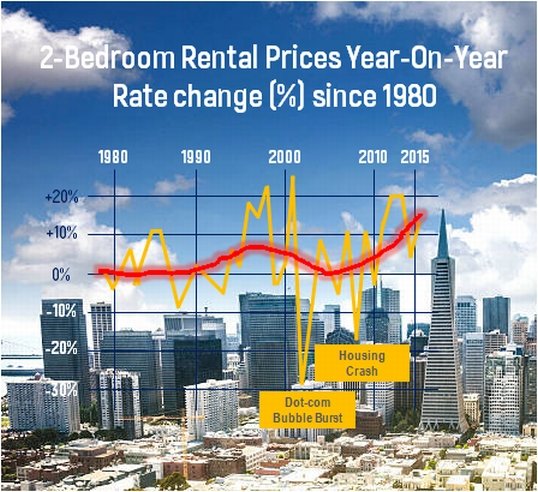
Bonus infographic: It turns out that median rent prices have risen only 15% in 1980 dollars over the past 35 years. Inflation-adjusted figures are eye-opening as much as the realisation we’re due another tech-related downturn in economy.